Application Performance Monitoring with Elastic APM Tool

Mithun Khatri
Software Engineer
Introduction
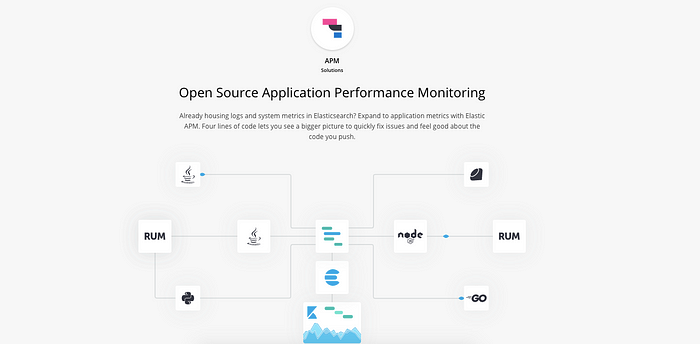
Elastic APM is a powerful tool which can be used to monitor overall application health and performance. It enables us to drill down to each and every dependent internal api calls, databases calls etc. and reveals hidden secrets.
Getting Started
Required tools
- Docker
elastic-apm-agentJava agent can be downloaded from : https://search.maven.org/search?q=a:elastic-apm-agent
Below steps can be followed to integrate application with APM tool and configure to start profiling.
docker-compose up -d below docker compose file
At this point, ElasticSearch, Kibana and apm-server have been wired together and ready to be attached to your application.
Now, start the application with the javaagent and pointing to apm-server url
Here,
apm.service_name → It can be the service name apm.server_url → url to apm server apm.application_packages → package where main class is present
Configuration steps on Kibana
- Goto : http://localhost:5601 (http://localhost:5601/)
- Click on Add APM
- Scroll down and click on Check APM Server Status
- Scroll down and click on Check agent status
- Click on Load Kibana objects
- Launch APM
APM is now ready and integrated with the service at this moment. Now try to do some operations on the UI or run some controller tests to see the transaction in APM.
References
✌️